Cloud Infrastructure Monitoring & Alerting Automation using AWS CloudWatch and SNS
📌 Project Description
Visibility into system health and performance (Observability) is critical for reliable cloud operations. This project demonstrates the implementation of proactive infrastructure monitoring and automated incident response using Amazon CloudWatch and Amazon Simple Notification Service (SNS).
Through this experiment, I engineered an alerting system designed to detect anomalous CPU spikes on Amazon EC2 instances as a common indicator of cyberattacks (e.g., crypto-jacking malware) or unexpected traffic surges and automatically dispatch real-time notifications to the administrative team.
🛠️ Tech Stack & AWS Services
- Management & Governance: Amazon CloudWatch (Metrics, Alarms, Dashboards).
- Application Integration: Amazon Simple Notification Service (SNS).
- Compute: Amazon EC2, AWS Systems Manager (Session Manager).
- Concepts: Cloud Observability, Automated Alerting, Stress Testing, Incident Response.
🏢 Business Scenario
A company experienced an incident where a production server was compromised and infected with compute-hijacking malware (crypto-miners), leading to degraded application performance and inflated AWS billing. As a Cloud Engineer, I designed a monitoring architecture to prevent recurrence. The solution continuously tracks the CPUUtilization metric and automatically triggers an email alert if the CPU load exceeds a safe threshold (60%), enabling the security team to investigate and intervene instantly.
🚀 Implementation Steps
Phase 1: Notification System Configuration (Amazon SNS)
- Provisioned a standard notification topic (
MyCwAlarm) in Amazon SNS to act as a centralized message hub. - Created a subscription profile utilizing the Email protocol and successfully verified the administrator’s email address to ensure guaranteed alert delivery.
Phase 2: CloudWatch Alarm Creation (Threshold & Trigger)
- Analyzed Amazon EC2 metrics specifically within the Per-Instance Metrics scope.
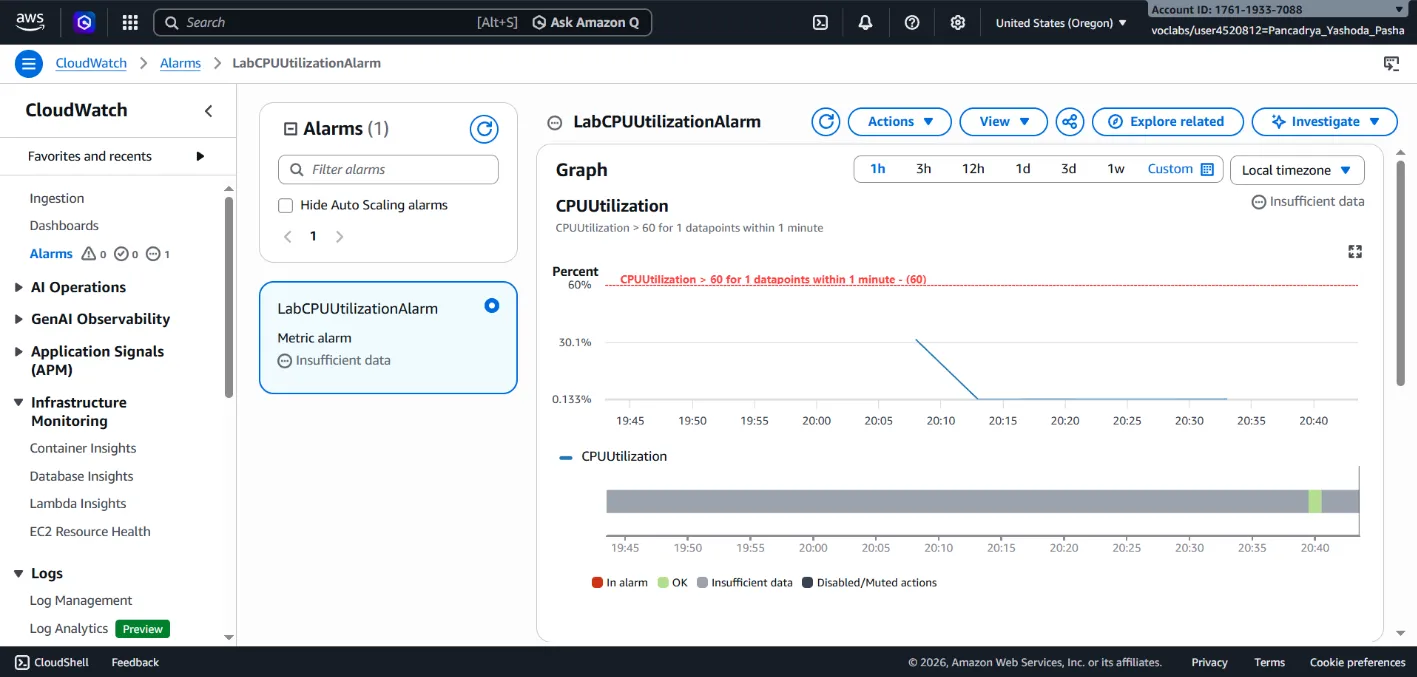
- Configured a CloudWatch Alarm (
LabCPUUtilizationAlarm) dedicated to monitoring theCPUUtilizationmetric. - Established a static threshold condition: If the Average CPU usage remains > 60% for a consecutive 1-minute period, the alarm state transitions to In alarm.
- Configured the alarm action to seamlessly trigger a message payload to the SNS topic established in Phase 1.
Phase 3: Incident Simulation (Stress Testing) & Validation
- Accessed the EC2 instance securely via AWS Systems Manager Session Manager.
- Simulated an anomalous/attack condition by executing the Linux
stressutility (sudo stress --cpu 10 -v --timeout 400s) to intentionally force the CPU load to 100%. - Monitored state changes within the CloudWatch console. Validated that the alarm successfully triggered (transitioned to In alarm status) within the defined time window.
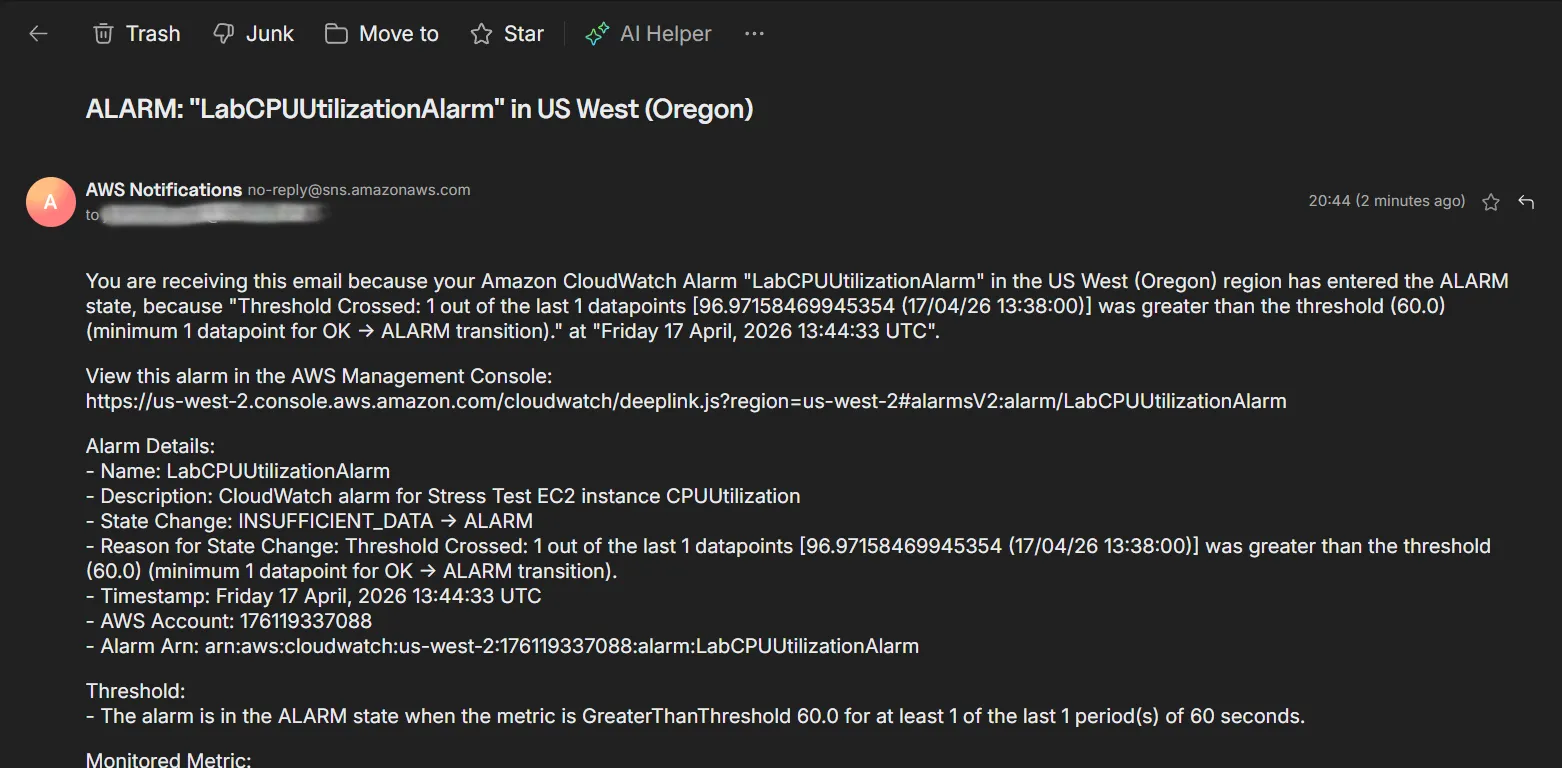
- Verified successful integration by receiving the automated email alert from AWS Notifications in the designated inbox.
Phase 4: Centralized Observability Dashboard Creation
- Engineered a custom CloudWatch Dashboard (
LabEC2Dashboard) to provide a Single Pane of Glass for IT operations. - Deployed a live line-graph widget to visualize the
CPUUtilizationmetric of the specific EC2 instance, facilitating continuous, high-level operational monitoring.
🎯 Results & Key Takeaways
- Proactive Incident Response: Successfully automated the detection and reporting of system anomalies, drastically reducing the team’s Mean Time to Respond (MTTR) from hours to minutes.
- Infrastructure Observability: Demonstrated proficiency in architecting centralized visual dashboards for real-time monitoring of mission-critical metrics.
- Load Generation & Validation: Showcased OS-level Linux technical skills by utilizing load-manipulation tools (
stress) to validate monitoring and security architectures prior to production deployment.